
Hits, effects and cell loss#
This page asks which treatments moved away from the controls, which measurements changed, and whether a hit is a phenotype or cells that died. Hit calls come with a permutation p-value and feature effects with Mann-Whitney q-values.
Potency has its own page, Concentration response. The same questions asked of single cells are on What the well median hides.
import matplotlib.pyplot as plt
import scanpy as sc

import mantispy as mt

# Palette shared with the mantispy plotters (mt.pl.hits, mt.pl.cytotoxicity):
# crimson = significant / flagged, blue = ordinary / ok, grey = background.
ACCENT = "crimson"  # significant / flagged / highlighted (mt.pl.hits "hit")
ACCENT_DARK = "#7a1b1f"  # a second flagged compound, darker crimson
NEUTRAL = "tab:blue"  # ordinary / not-flagged (mt.pl.cytotoxicity "ok")
NULL = "lightgrey"  # not-significant / background (mt.pl.hits "not called")
A screen with replicates#
pki is a kinase inhibitor set from the Broad Institute and the Gray lab: fifteen compounds, eleven of them at three
doses, in four cell lines (PATU-8988T, MDA-MB-231, U2OS and A549, two plates each). A treatment has 32 to 64
replicate wells across the four lines, 8 to 16 within one. That much replication is unusual, and it makes this
a good place to see what a hit call does when the design is generous.
This page pools the four lines, so a hit here is a treatment that moved in the pooled wells. To call hits in one
line, subset by Metadata_CellLine first.
The preparation is the one from Normalize, select, aggregate.
wells = mt.ds.pki()
mt.pp.normalize(wells, by="Metadata_Plate", reference="negcon")
mt.pp.feature_select(wells, na_cutoff=0.0)
wells = mt.pp.subset_features(wells)
sc.pp.pca(wells, n_comps=20)
wells
AnnData object with n_obs × n_vars = 3072 × 854
    obs: 'Metadata_plate_map_name', 'Metadata_broad_sample', 'Metadata_mg_per_ml', 'Metadata_mmoles_per_liter', 'Metadata_solvent', 'Metadata_Plate', 'Metadata_Well', 'Metadata_Site_Count', 'Metadata_Count_Cells', 'Metadata_Count_CellsIncludingEdges', 'Metadata_Count_Cytoplasm', 'Metadata_Count_Nuclei', 'Metadata_Count_NucleiIncludingEdges', 'Metadata_Object_Count', 'Metadata_Barcode', 'Metadata_Supplier', 'Metadata_Supplier_Catalog', 'Metadata_pert_type', 'Metadata_control_type', 'Metadata_Row', 'Metadata_Col', 'Metadata_CellCount', 'Metadata_SiteCount', 'Metadata_Control_Type', 'Metadata_Control', 'Metadata_Compound', 'Metadata_Concentration', 'Metadata_ConcentrationUnit', 'Metadata_MOA', 'Metadata_Perturbation', 'Metadata_Perturbation_Type', 'Metadata_CellLine'
    var: 'object', 'feature_group', 'feature', 'channel', 'scale', 'angle', 'gray_levels', 'radial_bin', 'params', 'is_feature', 'feature_kind', 'degenerate_scale', 'selected'
    uns: 'mantispy', 'pca'
    obsm: 'X_pca'
    varm: 'PCs'
    layers: None (.X)
Calling hits#
hit_calling() scores each group’s median distance from the control centroid, measured in the
controls’ own covariance so that directions the controls already vary in count for less. The null is the other
ways to draw a group of that size from the group and the held-out controls pooled.
Hit callers on well profiles compares this default with method="mp_value", which also
counts the spread of the treatment’s own wells.
With 854 features and 832 control wells, half of them held out, the covariance would be singular, so the distance is read on a PCA representation. The function says so itself if you forget.
mt.tl.hit_calling(wells, groupby="Metadata_Perturbation", use_rep="X_pca", n_permutations=1000)
mt.pl.hits(wells, label_top=6);
hits = wells.uns["mantispy"]["hits"].set_index("group")
hits.sort_values("distance", ascending=False).head(6)
| n_obs | distance | pvalue | qvalue | is_hit | |
|---|---|---|---|---|---|
| group | |||||
| BRD-U00086674-001-01-9@0.4 | 64 | 52.776536 | 0.000999 | 0.001186 | True |
| BRD-U00086675-001-01-9@0.4 | 64 | 38.652360 | 0.000999 | 0.001186 | True |
| BRD-K95785537-001-26-9@2.0 | 32 | 22.591774 | 0.000999 | 0.001186 | True |
| BRD-U00086675-001-01-9@0.2 | 64 | 20.786833 | 0.000999 | 0.001186 | True |
| BRD-K15179513-001-03-4@2.0 | 32 | 19.735967 | 0.000999 | 0.001186 | True |
| BRD-U00086674-001-01-9@0.2 | 64 | 19.050291 | 0.000999 | 0.001186 | True |
# Every treatment's hit distance, reusing the table hit_calling already wrote (no recompute).
ranked = hits.sort_values("distance", ascending=False)
colours = [ACCENT if is_hit else NULL for is_hit in ranked["is_hit"]]

fig, ax = plt.subplots(figsize=(7, 4))
ax.bar(range(len(ranked)), ranked["distance"], color=colours, width=1.0)
ax.set_xticks([])
ax.set_xlabel("treatment, ranked by distance")
ax.set_ylabel("distance from controls")
ax.set_title("Hit distances across all treatments")
handles = [
    plt.Rectangle((0, 0), 1, 1, color=ACCENT),
    plt.Rectangle((0, 0), 1, 1, color=NULL),
]
ax.legend(handles, ["significant (is_hit)", "not significant"], frameon=False, fontsize=8)
fig.tight_layout()
plt.show()
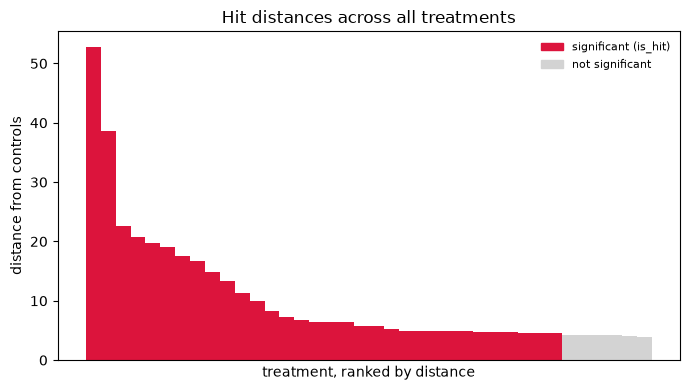
A handful of treatments tower over the rest, and the coloured bars are the ones whose permutation q-value clears significance; everything in grey below them is within reach of a control-sized draw.
Which features moved#
A hit call says a treatment moved. It does not say what changed. effect_size() gives a
per-feature effect against the controls with Mann-Whitney p-values, and one BH correction over the whole table.
mt.tl.effect_size(wells, groupby="Metadata_Perturbation", reference="negcon")
strongest = hits.drop(index="DMSO")["distance"].idxmax()

mt.pl.feature_volcano(wells, group=strongest);
import numpy as np

# Reuse the effect-size table tl.effect_size already wrote; do not recompute.
effects = wells.uns["mantispy"]["effect"]
top_hits = hits.drop(index="DMSO").sort_values("distance", ascending=False).head(8).index.tolist()

grid = effects[effects["group"].isin(top_hits)].pivot(index="feature", columns="group", values="effect")[top_hits]
top_features = grid.abs().max(axis=1).sort_values(ascending=False).head(18).index
grid = grid.loc[top_features]

_COMPARTMENTS = ("Cytoplasm_", "Nuclei_", "Cells_")
_CHANNELS = ("DNA", "ER", "RNA", "AGP", "Mito", "Brightfield")


def short(name):
    """Shorten a CellProfiler feature name to its family and channel, dropping the compartment prefix and trailing indices."""
    label = name
    for prefix in _COMPARTMENTS:
        if label.startswith(prefix):
            label = label[len(prefix) :]
            break
    parts = label.split("_")
    channels = [p for p in parts if p in _CHANNELS]
    if channels:
        family = parts[: parts.index(channels[0])]
        return "_".join(family) + " " + " ".join(channels)
    while parts and parts[-1].isdigit():
        parts.pop()
    return "_".join(parts)


def tick(group):
    """Shorten a treatment label to its first two compound tokens plus the dose."""
    head, dose = group.split("@")
    return "-".join(head.split("-")[:2]) + "@" + dose


vmax = float(np.nanmax(np.abs(grid.to_numpy())))
fig, ax = plt.subplots(figsize=(7, 5.5))
im = ax.imshow(grid.to_numpy(), aspect="auto", cmap="RdBu_r", vmin=-vmax, vmax=vmax)
ax.set_xticks(range(grid.shape[1]))
ax.set_xticklabels([tick(g) for g in grid.columns], rotation=90, fontsize=7)
ax.set_yticks(range(grid.shape[0]))
ax.set_yticklabels([short(f) for f in grid.index], fontsize=7)
fig.colorbar(im, ax=ax, label="signed effect size (Cohen's d)")
ax.set_title("Shared feature responses across the top hits")
fig.tight_layout()
plt.show()
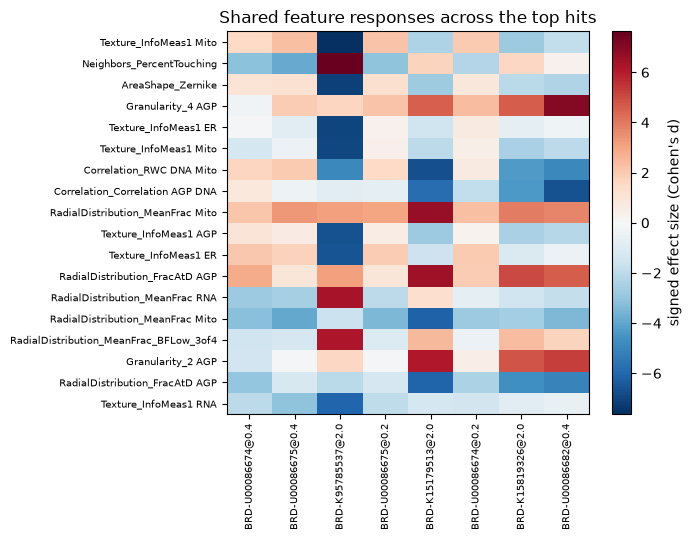
Columns that share a red-and-blue pattern move the same features in the same direction, which is the raw material for asking whether two compounds share a mechanism in Mechanism of action.
Each point is one CellProfiler measurement. The named ones are where this compound’s effect lives, and they are the handle for the next question, whether two compounds move the same features, which is Mechanism of action.
One profile per perturbation#
Replicate wells of a treatment are combined into a signature with consensus().
signatures = mt.tl.consensus(wells, by="Metadata_Perturbation", method="median")
print(f"{wells.n_obs} wells -> {signatures.n_obs} signatures")
signatures
3072 wells -> 38 signatures
AnnData object with n_obs × n_vars = 38 × 854
    obs: 'Metadata_Perturbation', 'Metadata_ReplicateCount', 'Metadata_plate_map_name', 'Metadata_broad_sample', 'Metadata_mg_per_ml', 'Metadata_mmoles_per_liter', 'Metadata_solvent', 'Metadata_Site_Count', 'Metadata_Barcode', 'Metadata_Supplier', 'Metadata_Supplier_Catalog', 'Metadata_pert_type', 'Metadata_control_type', 'Metadata_Control_Type', 'Metadata_Control', 'Metadata_Compound', 'Metadata_Concentration', 'Metadata_ConcentrationUnit', 'Metadata_MOA', 'Metadata_Perturbation_Type', 'hits_distance', 'hits_qvalue'
    var: 'object', 'feature_group', 'feature', 'channel', 'scale', 'angle', 'gray_levels', 'radial_bin', 'params', 'is_feature', 'feature_kind', 'degenerate_scale', 'selected'
    uns: 'mantispy'
    layers: None (.X)
# How consistent are a treatment's replicate wells? percent_replicating takes the median pairwise
# correlation within each perturbation's replicates and compares it to a non-replicate null.
treated = wells[wells.obs["Metadata_Control_Type"].to_numpy() != "negcon"].copy()
mt.tl.percent_replicating(treated, groupby="Metadata_Perturbation", metric="pearson")
agreement = treated.uns["mantispy"]["percent_replicating"]["median_replicate_correlation"]

fig, ax = plt.subplots(figsize=(6, 4))
ax.hist(agreement, bins=20, color=ACCENT)
ax.set_xlabel("median replicate correlation")
ax.set_ylabel("treatments")
ax.set_title("How consistent are replicate wells")
fig.tight_layout()
plt.show()
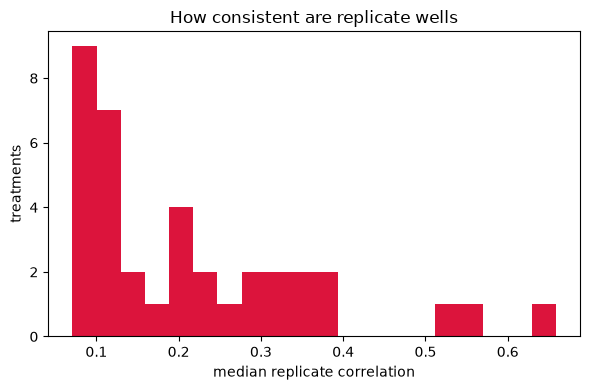
Most treatments’ replicates agree closely, so a plain median loses little; the low-correlation tail is where replicates disagree and where modz, by down-weighting off-consensus wells, earns its keep.
median is the default and is what pycytominer does by default. modz weights each replicate by how well it
agrees with the others, which helps when replicates are few and noisy.
Is it a hit, or did the cells die?#
A compound that kills four fifths of the cells leaves a well median computed from a fifth as many cells, and that median moves away from the controls for reasons unrelated to the biology being screened. It looks like a strong hit.
The cell count is also a baseline to beat. Seal et al. [2025] found that across three bioactivity benchmarks a model given only the cell count often matched one given the whole Cell Painting profile, and Ewald et al. [2026] found that profiles predicted LDH release no better than cell count, plate and well position.
cytotoxicity() reads the two together: each group’s viability, its cells per field
against the controls’, beside its median distance from the controls.
mt.tl.cytotoxicity(wells)
wells.uns["mantispy"]["cytotoxicity"].round(3)
| group | n_obs | viability | distance | suspect | |
|---|---|---|---|---|---|
| 0 | BRD-K15179513-001-03-4@2.0 | 32 | 0.783 | 19.736 | False |
| 1 | BRD-K15819326-001-01-6@2.0 | 32 | 0.840 | 17.581 | False |
| 2 | BRD-K40109029-001-06-9@2.0 | 32 | 0.831 | 14.826 | False |
| 3 | BRD-K95785537-001-26-9@2.0 | 32 | 0.763 | 22.592 | False |
| 4 | BRD-U00086672-001-01-9@0.2 | 64 | 1.030 | 4.096 | False |
| 5 | BRD-U00086672-001-01-9@0.4 | 64 | 1.012 | 4.696 | False |
| 6 | BRD-U00086672-001-01-9@1.0 | 64 | 0.983 | 5.705 | False |
| 7 | BRD-U00086673-001-01-9@0.2 | 64 | 0.998 | 4.861 | False |
| 8 | BRD-U00086673-001-01-9@0.4 | 64 | 0.988 | 4.974 | False |
| 9 | BRD-U00086673-001-01-9@1.0 | 64 | 0.972 | 5.723 | False |
| 10 | BRD-U00086674-001-01-9@0.04 | 64 | 0.973 | 6.385 | False |
| 11 | BRD-U00086674-001-01-9@0.2 | 64 | 0.676 | 19.050 | True |
| 12 | BRD-U00086674-001-01-9@0.4 | 64 | 0.266 | 52.777 | True |
| 13 | BRD-U00086675-001-01-9@0.04 | 64 | 0.935 | 6.823 | False |
| 14 | BRD-U00086675-001-01-9@0.2 | 64 | 0.497 | 20.787 | True |
| 15 | BRD-U00086675-001-01-9@0.4 | 64 | 0.331 | 38.652 | True |
| 16 | BRD-U00086676-001-01-9@0.004 | 64 | 0.968 | 10.015 | False |
| 17 | BRD-U00086676-001-01-9@0.01 | 64 | 0.973 | 11.331 | False |
| 18 | BRD-U00086676-001-01-9@0.04 | 64 | 0.931 | 13.404 | False |
| 19 | BRD-U00086677-001-01-9@0.004 | 64 | 1.013 | 4.158 | False |
| 20 | BRD-U00086677-001-01-9@0.01 | 64 | 1.008 | 4.202 | False |
| 21 | BRD-U00086677-001-01-9@0.04 | 64 | 0.997 | 4.649 | False |
| 22 | BRD-U00086678-001-01-9@0.004 | 64 | 0.979 | 4.800 | False |
| 23 | BRD-U00086678-001-01-9@0.01 | 64 | 0.996 | 4.668 | False |
| 24 | BRD-U00086678-001-01-9@0.04 | 64 | 1.005 | 5.304 | False |
| 25 | BRD-U00086679-001-01-9@0.2 | 64 | 0.990 | 4.519 | False |
| 26 | BRD-U00086679-001-01-9@0.4 | 64 | 0.991 | 4.827 | False |
| 27 | BRD-U00086679-001-01-9@1.0 | 64 | 1.044 | 4.960 | False |
| 28 | BRD-U00086680-001-01-9@0.04 | 64 | 1.000 | 4.155 | False |
| 29 | BRD-U00086680-001-01-9@0.2 | 64 | 1.000 | 6.368 | False |
| 30 | BRD-U00086680-001-01-9@0.4 | 64 | 1.005 | 7.186 | False |
| 31 | BRD-U00086681-001-01-9@0.04 | 64 | 1.005 | 4.192 | False |
| 32 | BRD-U00086681-001-01-9@0.2 | 64 | 0.994 | 4.577 | False |
| 33 | BRD-U00086681-001-01-9@0.4 | 64 | 1.049 | 4.858 | False |
| 34 | BRD-U00086682-001-01-9@0.04 | 64 | 1.030 | 6.501 | False |
| 35 | BRD-U00086682-001-01-9@0.2 | 64 | 0.983 | 8.313 | False |
| 36 | BRD-U00086682-001-01-9@0.4 | 64 | 0.941 | 16.647 | False |
| 37 | DMSO | 832 | 1.000 | 3.915 | False |
mt.pl.cytotoxicity(wells);
# Join the cytotoxicity table to each treatment's compound and dose, then follow the flagged compounds down the ladder.
cyto = wells.uns["mantispy"]["cytotoxicity"]
meta = wells.obs.groupby("Metadata_Perturbation", observed=True)[
    ["Metadata_Compound", "Metadata_Concentration"]
].first()
viability_table = cyto.join(meta, on="group")
flagged = viability_table.loc[viability_table["suspect"], "Metadata_Compound"].unique()

# These are the same two compounds mt.pl.cytotoxicity draws as crimson "suspect" points above.
# Colour them in crimson too, the more-toxic one (lowest surviving fraction) in ACCENT and the
# second in a darker crimson, so the reader connects the two figures.
toxicity = viability_table[viability_table["Metadata_Compound"].isin(flagged)]
order = toxicity.groupby("Metadata_Compound", observed=True)["viability"].min().sort_values().index
palette = dict(zip(order, [ACCENT, ACCENT_DARK], strict=False))

fig, ax = plt.subplots(figsize=(6, 4))
for compound in flagged:
    block = viability_table[viability_table["Metadata_Compound"] == compound].sort_values(
        "Metadata_Concentration", key=lambda s: s.astype(float)
    )
    dose = block["Metadata_Concentration"].astype(float)
    label = "-".join(str(compound).split("-")[:2])
    ax.plot(dose, block["viability"], marker="o", color=palette[compound], label=label)
ax.axhline(1.0, color="0.7", lw=1, ls="--")
ax.set_xscale("log")
ax.set_xlabel("dose (Metadata_Concentration)")
ax.set_ylabel("viability (cells per field vs controls)")
ax.set_title("Viability falls at the top doses")
ax.legend(frameon=False, fontsize=8)
fig.tight_layout()
plt.show()
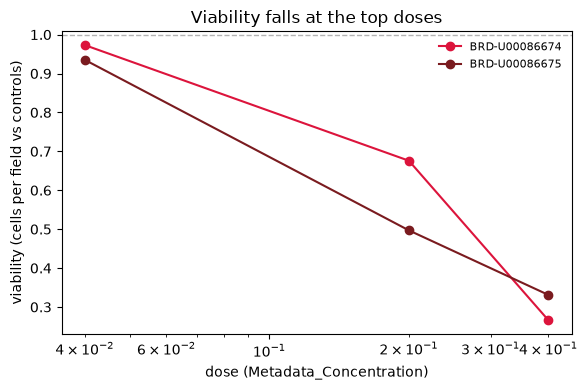
Both flagged compounds keep a control-sized complement of cells at their lowest dose and lose a growing share of it at the two highest, which is the confound tl.cytotoxicity marks: a large distance at high dose is partly cells dying rather than phenotype.
Two compounds are flagged, each at its two highest doses, which keep between 27% and 68% of the
controls’ cells. The strongest, BRD-U00086674 at 0.4, keeps 27% of its cells and sits further from the controls
than any other treatment. At its lowest dose, 0.04, its cells survive and it sits close to the controls.
Both conditions have to hold. Cell loss alone is a phenotype (a compound that arrests growth is a real finding),
and a large distance alone is a hit. Only the combination is suspect. tl.cytotoxicity is a diagnostic and does
not correct anything.
Fewer cells, a noisier profile#
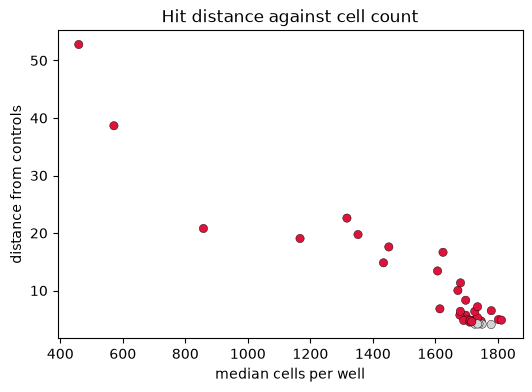
Cell loss has a second, quieter effect. A well median built from few cells is noisier than one built from many, so a treatment with few cells can sit away from the controls through sampling noise alone, even where no cell changed. The first check is whether distance follows cell count across the treatments.
cell_count = wells.obs.groupby("Metadata_Perturbation", observed=True)["Metadata_CellCount"].median()
by_count = hits.drop(index="DMSO").join(cell_count)

fig, ax = plt.subplots(figsize=(6, 4))
ax.scatter(
    by_count["Metadata_CellCount"],
    by_count["distance"],
    c=[ACCENT if is_hit else NULL for is_hit in by_count["is_hit"]],
    edgecolors="black",
    linewidths=0.3,
)
ax.set_xlabel("median cells per well")
ax.set_ylabel("distance from controls")
ax.set_title("Hit distance against cell count")
plt.show()
round(float(by_count["Metadata_CellCount"].corr(by_count["distance"], method="spearman")), 2)
-0.79
Distance and cell count move together. The rank correlation across treatments is -0.8, and the treatments with the fewest cells, a few hundred per well against about 1,700 in a control well, sit furthest out. They include the cytotoxic doses flagged above, so part of their distance is phenotype and part may be noise from small samples.
pki ships only well profiles, so the next cell measures that noise on the single cells of another plate,
jump_cells(). It draws a given number of cells from the DMSO wells, takes their median profile, and
records how far it sits from the median of all DMSO cells, as the median shift across features in units of the
controls’ standard deviation. No treatment is involved, so any distance is sampling noise.
import pandas as pd

cells = mt.ds.jump_cells()
dmso = np.asarray(cells[cells.obs["Metadata_Control_Type"].to_numpy() == "negcon"].X, dtype=float)
spread = np.nanstd(dmso, axis=0)
usable = np.isfinite(spread) & (spread > 0)
z = (dmso[:, usable] - np.nanmean(dmso[:, usable], axis=0)) / spread[usable]
centre = np.nanmedian(z, axis=0)

rng = np.random.default_rng(0)
floor = []
for n_cells in (10, 25, 50, 100, 250, 500, 1000):
    drift = [
        np.nanmedian(np.abs(np.nanmedian(z[rng.choice(len(z), n_cells, replace=False)], axis=0) - centre))
        for _ in range(50)
    ]
    floor.append(
        {
            "cells": n_cells,
            "median drift": round(float(np.median(drift)), 3),
            "95th percentile": round(float(np.quantile(drift, 0.95)), 3),
        }
    )
pd.DataFrame(floor)
| cells | median drift | 95th percentile | |
|---|---|---|---|
| 0 | 10 | 0.154 | 0.222 |
| 1 | 25 | 0.100 | 0.147 |
| 2 | 50 | 0.070 | 0.098 |
| 3 | 100 | 0.051 | 0.073 |
| 4 | 250 | 0.031 | 0.042 |
| 5 | 500 | 0.021 | 0.027 |
| 6 | 1000 | 0.014 | 0.017 |
The drift falls with the square root of the cell count. A median of 10 DMSO cells sits 0.154 control standard deviations from the centre in a typical feature, 100 cells 0.051 and 1,000 cells 0.014, about a factor of three for every tenfold change. A profile built from few cells therefore starts out some distance from the controls before any phenotype. Read a low-count hit against the noise floor at its own cell count, computed on your own data and in the same units as the hit distance, and treat a strong hit with few cells with care. Regressing the cell count out of the features, as in Plate artifacts, is another option.
Summary#
A hit call says a treatment moved away from the controls.
effect_size()says which features moved, andconsensus()gives one signature per treatment.Cell loss and phenotype are confounded by construction. Flag the combination with
cytotoxicity()instead of correcting it away.A profile from few cells is noisier, so distance follows cell count. Compare a low-count hit with the noise floor at the same count.
Next: Mechanism of action, which asks whether two treatments moved the same way.
Hit callers on cells and on guide profiles runs the three hit_calling statistics on single cells and on guide profiles of
one screen and compares their calls with genes whose answer is known.