
Quickstart#
This page runs an image-based profiling screen from the raw object to a mechanism call, on one dataset, in one narrative. Every analytical step names a biological question, runs a few lines, draws a figure, and reads it back off. The other tutorials each take one of these steps in depth; here the point is the whole shape of the workflow.
Everything is a scverse object. adata.obs records where each profile came from, adata.var records what each
feature measures, and adata.uns["mantispy"] holds every result table. scanpy’s PCA, neighbours and embeddings
work on it unchanged, so no result exists only in a notebook variable.
import matplotlib.pyplot as plt
import numpy as np
import scanpy as sc

import mantispy as mt
A screen in one object#
BBBC021 is the field’s reference compound screen: MCF-7 cells, 38 compounds at one to seven concentrations, with
published mechanism-of-action labels. mt.ds.bbbc021() downloads and caches it, and hands back an ordinary
AnnData.
adata = mt.ds.bbbc021()
adata
AnnData object with n_obs × n_vars = 632 × 467
    obs: 'Metadata_Plate', 'Metadata_Well', 'Metadata_Compound', 'Metadata_Concentration', 'Metadata_MOA', 'Metadata_CellCount', 'Metadata_SiteCount', 'Metadata_Row', 'Metadata_Col', 'Metadata_Control', 'Metadata_Control_Type', 'Metadata_ConcentrationUnit', 'Metadata_Perturbation', 'Metadata_Perturbation_Type'
    var: 'object', 'feature_group', 'feature', 'channel', 'scale', 'angle', 'gray_levels', 'radial_bin', 'params', 'is_feature', 'feature_kind'
    uns: 'mantispy'
    layers: None (.X)
print(
    f"{adata.n_obs} wells x {adata.n_vars} features, resolution={adata.uns['mantispy']['resolution']}, "
    f"grouped_by={list(adata.uns['mantispy']['grouped_by'])}"
)
632 wells x 467 features, resolution=well, grouped_by=['Metadata_Plate', 'Metadata_Well']
Rows are wells, columns are CellProfiler features, and every Metadata_ column in obs says what a well is: its
plate, its compound and concentration, its mechanism label, its cell count. Nothing here is mantispy-specific yet.
A scanpy user already knows this object.
Quality control: is the data worth analyzing?#
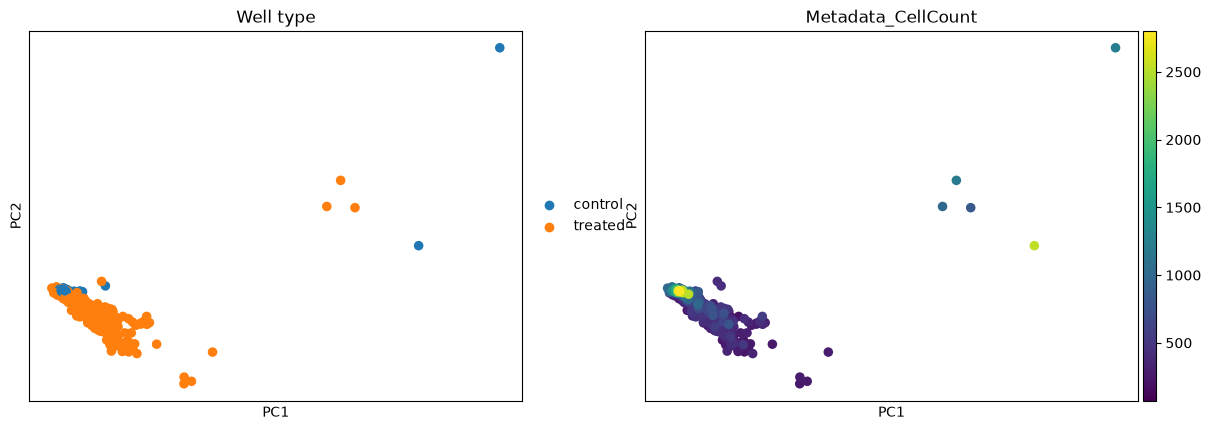
This first step is quality control. Two questions decide whether the screen is usable: do treated wells look different from the negative controls at all, and how much of what we see is the plate rather than the biology? Putting every plate on the scale of its own DMSO wells is what handles the second, since it removes each plate’s own baseline; we then keep the informative features and look at a PCA to check the first.
mt.pp.normalize(adata, method="mad_robustize", by="Metadata_Plate", reference="negcon", keep_raw=True)
mt.pp.feature_select(adata, na_cutoff=0.0)
adata = mt.pp.subset_features(adata)

sc.pp.pca(adata, n_comps=30)
adata.obs["Well type"] = np.where(adata.obs["Metadata_Control"].to_numpy(), "control", "treated")
sc.pl.pca(adata, color=["Well type", "Metadata_CellCount"], ncols=2, show=False)
plt.show()
# How much of the spread is the compound, and how much is the plate it ran on?
def variance_share(labels):
    """Fraction of the PCA variance that lies between groups of ``labels``, variance-weighted over PCs."""
    X = adata.obsm["X_pca"]
    weights = adata.uns["pca"]["variance_ratio"][: X.shape[1]]
    codes = np.unique(labels, return_inverse=True)[1]
    means = np.vstack([X[codes == c].mean(0) for c in range(codes.max() + 1)])[codes]
    between = ((means - X.mean(0)) ** 2).sum(0)
    total = ((X - X.mean(0)) ** 2).sum(0)
    return float(np.average(between / total, weights=weights))


{
    "from the compound": round(variance_share(adata.obs["Metadata_Perturbation"].to_numpy()), 2),
    "from the plate": round(variance_share(adata.obs["Metadata_Plate"].to_numpy()), 2),
}
{'from the compound': 0.45, 'from the plate': 0.23}
The treated wells spread away from the control cloud, so there is a signal to call. The split above says how much of that spread is biology and how much is the plate: the compound explains more of the variance than the plate does, now that each plate is on its own DMSO scale, though plate structure is reduced rather than erased. Two other things ride the same map: cell count changes smoothly along one direction (a confounder returned to under hits), and a handful of wells sit apart whatever their treatment. Is the screen any good? looks at the leftover plate structure in detail.
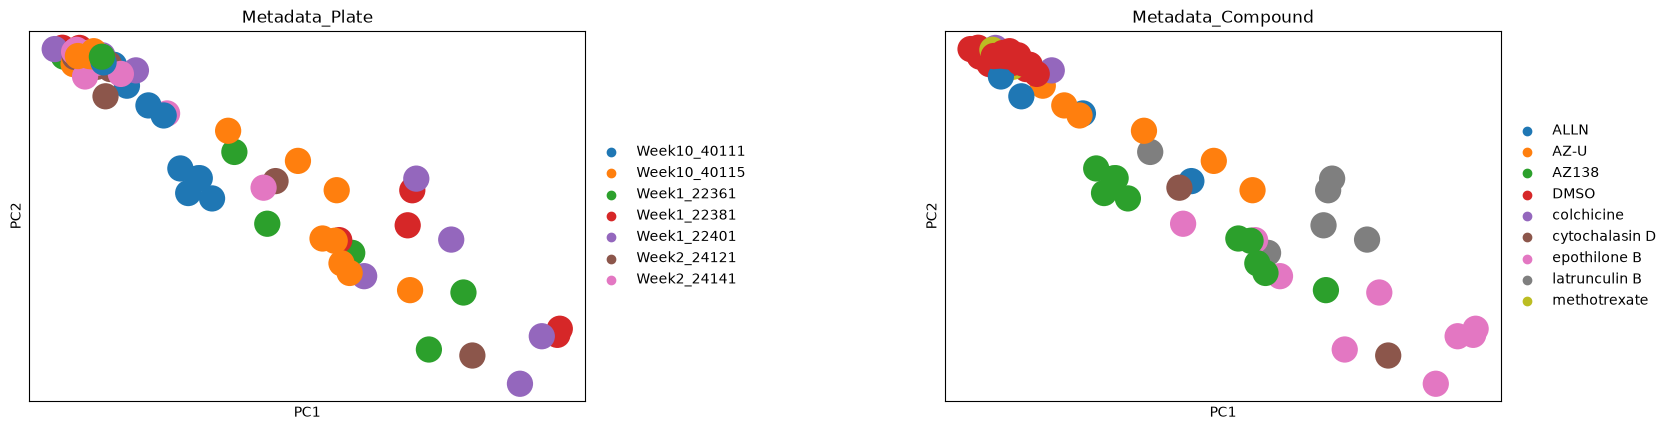
To see the split rather than read it as a number, here is the same PCA for seven plates, coloured once by plate and once by compound. Wells from every plate lie along the same diagonal, and where a well sits on it follows its compound. The DMSO wells sit together at the top left, while AZ138, latrunculin B and epothilone B wells lie progressively further out.
plates = adata.obs["Metadata_Plate"].unique()[:7]
sc.pl.pca(
    adata[adata.obs["Metadata_Plate"].isin(plates)].copy(),
    color=["Metadata_Plate", "Metadata_Compound"],
    ncols=2,
    wspace=0.5,
    show=False,
)
plt.show()
What normalization did#
BBBC021 ships at well level, so there is no cell-to-well aggregation step here (on single cells it would be
wells = mt.tl.aggregate(cells)). The effect of the normalization above is easiest to see as a before-and-after
of a few features, split into control and treated wells.
mt.pl.feature_distributions(adata, features=list(adata.var_names[:3]), groupby="Well type", group_label="Well type");
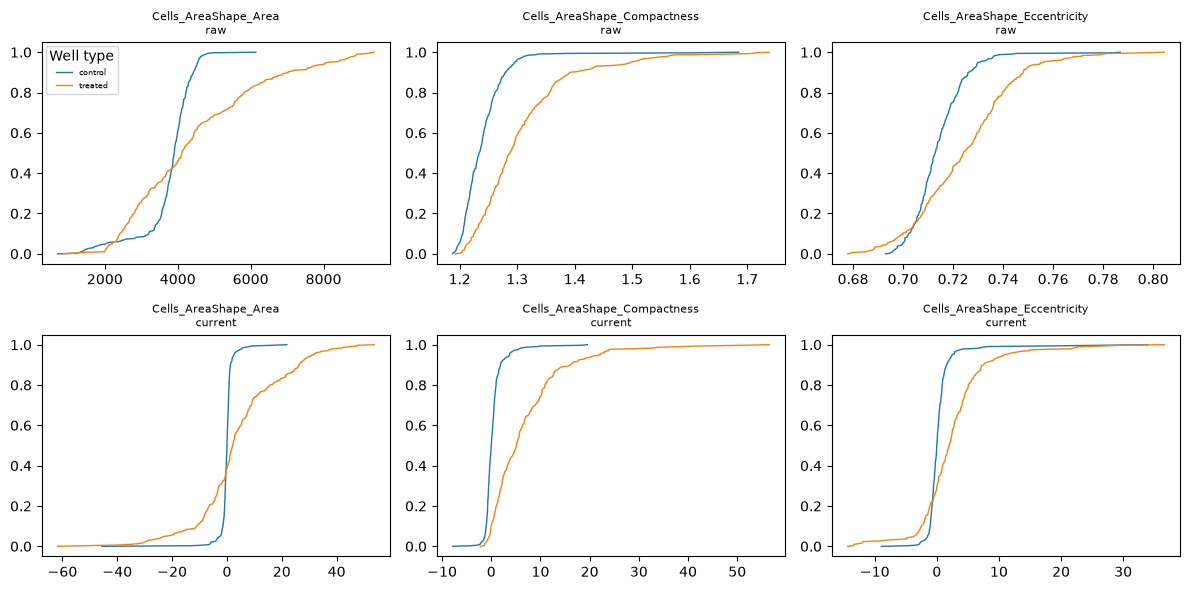
Before normalization the control curves are wide, because they pool the control wells of every plate, and the raw features are in their own units: an area in pixels (multiply by the squared pixel size to get µm²), an eccentricity near zero for a near-circular cell. After normalization the control curves are steep steps at zero, because each plate’s control wells have a median of zero by construction (the centring is per plate, not per well), and a treated well is read as its distance from that shared baseline. The values are then multiples of the controls’ own spread rather than raw measurements, so features on different scales become comparable and every downstream distance is measured on this cleaned scale.
One profile per treatment#
A treatment here is a compound at a single concentration, so the same compound at two doses counts as two
treatments. Its replicate wells are noisy, and a screen is easier to reason about as one signature per treatment.
tl.consensus collapses the replicate wells of each treatment, taking the median by default (what pycytominer does).
treated = adata[~adata.obs["Metadata_Control"].to_numpy()].copy()
signatures = mt.tl.consensus(treated, method="median", min_replicates=1)
signatures = signatures[signatures.obs["Metadata_MOA"].notna().to_numpy()].copy()
print(
    f"{treated.n_obs} treated wells -> {signatures.n_obs} treatment signatures"
    f" over {signatures.obs['Metadata_MOA'].nunique()} mechanisms"
)
302 treated wells -> 103 treatment signatures over 12 mechanisms
One row per treatment now, each the median of its replicate wells. These signatures are what the mechanism step compares.
What is a hit?#
A hit is a treatment whose profile moved away from the controls by more than the controls vary among themselves.
tl.hit_calling scores that distance in the controls’ own covariance and gives it a permutation p-value;
tl.effect_size then says which features moved.
Three replicate wells are too few to estimate a treatment’s covariance on its own, but enough to average it with the
controls’. method="mp_value", the multidimensional perturbation value of Hutz et al. (2013), measures the shift in
that average, so a treatment whose replicate wells disagree with each other scores lower;
hit callers on well profiles compares it with the default.
When a treatment changes how spread out its cells are, for example when only the cells that enter mitosis arrest,
test single cells with method="hellinger", which compares the spread of both groups as well as their centres; the
hit-calling methods tutorial compares it with the default.
Some of mantispy’s plots have an interactive plotly version, used where hovering over points helps. When the interactive extra is installed (pip install 'mantispy[interactive]', or uv add 'mantispy[interactive]' in a uv project) those plots are drawn with plotly instead of matplotlib, which is why the style changes here; the rest stay matplotlib either way.
mt.tl.hit_calling(adata, groupby="Metadata_Perturbation", use_rep="X_pca", n_permutations=1000)
mt.tl.effect_size(adata, groupby="Metadata_Perturbation")

hits = adata.uns["mantispy"]["hits"]
mt.pl.hits(adata)
mt.pl.feature_volcano(adata, group=hits.nlargest(1, "distance")["group"].iloc[0]);
Most treatments clear the threshold and the DMSO control does not: the assay separates active from inactive. The volcano for the strongest hit names the individual measurements carrying its phenotype, which is the handle for asking what the compound does.
One caveat before trusting a strong morphological hit: a compound that kills most of the cells also moves the well
median. That is real biology, a viability hit, but not the morphological phenotype the screen is reading, so the
two are worth telling apart. tl.cytotoxicity reads distance against viability to do that.
mt.tl.cytotoxicity(adata)
mt.pl.cytotoxicity(adata);
Groups in the upper left are far from the controls and have lost most of their cells: their distance is a viability hit, not the morphological phenotype being screened. A large distance with intact viability is the morphological hit worth following.
What does it do?#
Mechanism is a retrieval question: does a treatment’s nearest neighbour share its mechanism, and where the assay
fails, which mechanisms does morphology confuse? tl.nn_moa_classify with the not-same-compound rule answers the
first. The rule excludes every well of the same compound, its other concentrations included, so a treatment must
be recognised from a different molecule with the same mechanism rather than from another dose of itself, which
would be an easier task.
mt.tl.nn_moa_classify(signatures, scheme="nsc")
mt.pl.moa_confusion(signatures);
The diagonal dominates: most treatments retrieve a different compound with the same mechanism. The largest off-diagonal block, Eg5 inhibitors against microtubule destabilizers, is biology (both arrest mitosis and look alike here) and not a failure of the classifier.
The whole map at once: tl.edistance gives every treatment-by-treatment distance, and pl.distance_heatmap
orders it by mechanism so related treatments form blocks on the diagonal.
mt.tl.edistance(signatures, reference=None)
mt.pl.distance_heatmap(signatures, groupby="Metadata_MOA");
Mechanism blocks stand out along the diagonal (compounds that share a mechanism sit close) while the off-diagonal shows which mechanisms the assay cannot separate. This is the same structure the confusion matrix summarised, now laid out treatment by treatment.
Everything is on the object#
Nothing above returned a result that lives only in a notebook variable. Hits and effect sizes are on adata, the
mechanism call is on signatures, and each result is a table under uns["mantispy"], beside the provenance of the
step that wrote it.
mt.io.write saves the object and every one of these tables in one .h5ad, and mt.io.read brings them back,
the same file a scanpy user can open.
Where to go next#
Each modality has its own tutorial that goes deeper than this page:
Compound screens, hits, effects and cell loss: activity, what moved, and whether a hit is a phenotype or dead cells.
Genetic screens, CRISPR knockouts: which knockouts have a phenotype, and whether the map recovers known biology.
Single cells, what the well median hides: the same questions asked below the well.
Across laboratories, cross-laboratory reproducibility: does the screen reproduce at another site.
How-to recipes, from a CellProfiler run and the other short data-loading examples.